]]>
Google
 
Web netmetrics.blogspot.com
 

Monday, September 26, 2005 

Announcing A Change of Blog URL for this Data Mining/Net Metrics Blog

After several weeks of thinking long and hard about it, I've decided to stop posting to this blog. Instead, I'm spllitting and combining several blogs, including this one. The less technical posts about data mining, web analytics and net metrics will be posted to my BlogSpinner blog. The more technical posts that involve programming techniques and/or mathematics will be moved to my "Webmastering" blog, which is being readied for release on my new website, Math Gurus Online. This website, when ready, will contain all my Internet tech and programming blogs. I'll announce this new site, when it's ready, here on this blog as a final posting. In the meantime, I have a post over at BlogSpinner about a data mining-related concept called the "long tail" phenomenon, about how your articles and blog posts can earn their dues over a long period of time, even if they don't have a lot of initial readership when you first post them. Enjoy, and keep an eye out for the final post here.

(c) Copyright 2005-present, Raj Kumar Dash, http://netmetrics.blogspot.com

Technorati : , , ,


Saturday, September 24, 2005 

A Hard Lesson - Buy A Hosting Plan That Gives You Access To Your Web Server Access Logs

I recently registered a couple of new domains - one for me and one for a client. I also took advantage of this very large, very well-known hosting company's special deal: buy a non-domain product and get a domain for a ridiculously low price. And the basic hosting plan for one year meant a similarly ridiculously low monthly cost. It ertainly beat what I used to pay only 5 years ago. Even my current consulting website's hosting plan costs about 3 times as much as the new website and has half the space and features. But what I realized after I'd paid up is that the new host doesn't give anyone access to their own server logs unless you get THEIR web stats package, which of course you have to pay for. It doesn't matter if you're paying US$3.95/m or $39.95/m, you have to pay extra.

Now, in the scheme of things, their stats package is not all that much more money. But I'm stubborn and it's the principle of thing that bugs me: Most host providers give you the server access logs as part of a normal suite of features. The total cost for both host providers ended up being almost the same, however, so my stubbornness is moot. The moral is, though, that if you plan to do your own data mining - which I prefer over cookie-cutter stats packages, then make sure your hosting plans offer log files at all - whether free or at a premium. You simply cannot do proper data mining without the raw logs.

BTW, this blog and all of my other techncial blogs will soon be moved over to a new "geek" site that'll have blogs, forums, free tutorials in PDF form, and private tutoring for certain subjects, at various knowledge levels. Once the new website is live, I'll announce it here and in my other tech blogs.

(c) Copyright 2005-present, Raj Kumar Dash, http://netmetrics.blogspot.com

Technorati : , , ,


Thursday, September 22, 2005 

Do Your Visitors Like Your Blog Content? How To Tell

If you're running a blogsite and have built it up with a fair bit of traffic, you may be finding some extreme fluctation in page views over time. While some fluctuation is normal in a fairly visible website/blogsite, extremes may be pointing to deeper issues. The first question to ask yourself is: Do my posts generally stick to one tight topic area? If they don't, this might be the reason for the decreases.

For example, I run four cooking blogs (at the time of this writing). One of them has been running longer, which might account for the greater number of readers. But the more popular one also appears to have the most fluctuation. When I run more personal stories about my experiences as a cook, I have less page views. When I run recipes, I have a greater response. Similarly, on another cooking blog, I talk about keeping your food budget down. When I write posts about growing your own veggies or buying time-saving kitchen gadgets, I get a lower response than just plain recipes. But if I combine info about gardening with a recipe into the same post, I get a better response altogether.

To determine if your readers similarly appear to have a preference for certain types of blog content, you have a few choices:

  1. Ask them. In your posts, occasionally suggest that your readers post a comment or drop you an email if the want to see some specific content. If you're writing a personal diary type of blog, however, it's unlikely that this method will work. In fact, for every person that does respond to this kind of request for any type of blog, many more will not.
  2. Run a poll. Post an actual polling form somewhere on your blog. (At the time of this writing, ProBlogger has a poll asking what type of posts readers want Darren to write.)
  3. Categorize each blog post that you write, then create a spreadsheet that matches categories against the page view counts that your web metrics/analytics software gives you. You'll need to have one column for each category. [For those that don't have software to analyze web site visits, I'll post some links in the future, as well as eventually post some Perl and or PHP scripts that do rudimentary analysis.]
This category analysis is not simple. You need to have many posts over an extended period of time. Ultimately, you can only "infer" results. In other words, you can never be 100% sure. Nevertheless, this analysis will provide you a reasonable inference to blog by if you have enough data.

(c) Copyright 2005-present, Raj Kumar Dash, http://netmetrics.blogspot.com

Technorati : , , , ,


Sunday, September 11, 2005 

Tracking Visitors To Your Website/ RSS Feeds/ Blogsites - Inaccuracies in Measurement

NOTE: This entry is co-posted on my GeoPlotting blog.

With the invention of the wi-fi laptop a few years ago, it's become harder to accurately track unique visitors to your website/ RSS feed/ blogsite visitors. Anyone who commutes a lot with a laptop may end up appearing as 3 or 4 different visitors in your web server access logs, possibly even as being from different cities. This of course inflates your readership/ subscriber numbers, which eventually may be something that advertisers, if you have any, may make you account for. While there is a new technique for identifying a computer anywhere geographically based each computer's unique clock skew, there's still the issue of accounting for Internet users that may use more than one computer in the course of a day.

Browser cookies work if visitors are using one computer each day, but at different locations (i.e., at least with different IP addresses, if not also geographically). However, cookies are unreliable and may get deleted.

Getting visitors to sign in works for some web sites, but may potentially reduce your readership if you force it upon everyone. Limited sign-on may be a better choice. For example, SlashDot lets anyone view their website, but you have to login to post a comment. You can datamine your web access logs and match them with logins, but only if every reader logins (not to mention, actually bothers to sign up).

In limited situations, logins may work - say for membership-only type of content. Examples would be sites serving up online course material, e-books, etc. But where does that leave other websites? One sinister, almost Big-Brother-like possibility is to force all users to access the Internet with some sort of card (e.g., credit card) or RFID-chip-based device. Let's hope this never comes to pass.

In the meantime, all we can do is make the assumption that each IP address represents a unique visitor and correct for this inaccuracy later, as we collect information through a variety of techniques.

(c) Copyright 2005-present, Raj Kumar Dash, http://geoplotting.blogspot.com


Friday, September 09, 2005 

More About Using Multiple Moving Averages For Internet Data Mining

Multiple Moving Averages (MMAs), as I mentioned in yesterday's post, have incredible value for determining what data trends have gone by, as well as for predicting what trends may come. I've noticed that there is an incredible skew in visitors to my consulting website coming from Korea and China. That in itself isn't bad. What's bad is that they are consistently trying to access the same non-existent pages and web scripts. Almost every single one of them is doing this. Now, I haven't yet checked if this is happening with visitors from other countries. And as my site has not yet seemed to be adversely affected, I haven't taken any drastic measures.

What I intend to do, as I collect more data, is to map the timeline of these "attacks". Many of them seem to happen within a few minutes of each other, which is often what happens when hackers try to create a DDOS, or Distributed Denial of Service. Basically, the idea is to so overload your web server that they cause it to crash. But this is usually done to websites that such hackers have some moralistic viewpoint against. I've done nothing to warrant this, so I don't really see it as a threat just yet. But once I have more visitor data in my web server logs, producing an MMA will help me to determine whether or not it is a threat, or just some strange Internet phenomenon.

(c) Copyright 2005-present, Raj Kumar Dash, http://netmetrics.blogspot.com


Thursday, September 08, 2005 

Moving Averages For Forecasting Trends in Internet Data

Moving Averages (MAs) are a powerful technique used to see short- and long-term trends in any time-based data. For example, stock market day traders use MAs using a "window" of a specified number of days to produce a "sliding average" of a stock's price, or of a market index. The resulting MA graph shows a smoother curve than the daily graph. From the MA, and assuming you have a reasonable window of time, you can see how a stock has been behaving and make an educated guess as to how it'll perform. The flaw in this technique is that if something drastic and random happens, you cannot predict it.

The MA method can be used to analyze trends in any data. If you are a website selling some products online, or a blogsite owner running advertising in your blogs, you can an MA to gauge how sales/revenue has been, and how it MIGHT be in the near future.

The technique in a nutshell:

(1) Have a sufficient period of data. I don't like to use anything less than 1 year, but that doesn't mean you can't. For ease of explanation, let's assume that we are measuring daily visitors to your blog(s).

(2) Choose a sliding window. If you want to gauge short-term trends, choose a short window, say, 15 days. If you want to gauge long-term trends, choose a longer window (up to 365 days). Keep in mind that the larger the window, the more data you must have or else the MA is bogus.

(3) Starting with day 1, add up the first 15 days of data (or whatever window you are using). Divide the total by the window size, i.e., 15 days. This is the first MA value, and it is plotted on day 15.

(4) Now slide over to day 2, and total up the data from day 2 through day 16, inclusive (15 day window). Divide the total once again by 15 days. This the second MA value, and it is plotted on day 16.

(5) Repeat this process until the end of the window includes the last day that you have data for. For example, if you have 35 days of data, then the last day for which you will calculate an average on the 15-d window is (35-15)+1 = day 21 (not day 20).

(6) The resulting graph of averages is the MA graph.

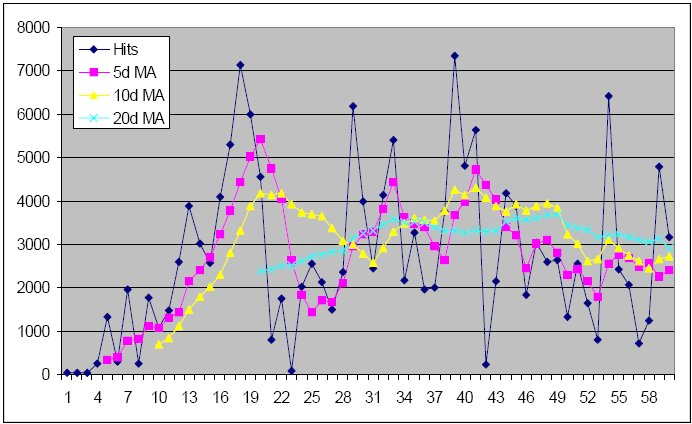
Of course, analyzing on a single window is not as useful as using multiple windows. For example, in the stock market, you want to analyze both short-term and long-term trends simultaneously, especially if you want to be a successful daytrader. Using multiple windows is called Multiple Moving Averages (MMAs). An example MMA graph is shown below:


The above graph shows the MMAs for a daily electronic writing journal I was keeping for my fiction and non-fiction a few years ago. The general measure is the number of words that I wrote each day. You can see how the light blue line, which uses a 20-day sliding window, is smoother than the dark blue line (which is the original data). The interval I've used in the example is too short to give meaningful results, but the techniques are sound. You can use these techniques to analyze both sales and visitors, and whether there is a correspondence between them.

(c) Copyright 2005-present, Raj Kumar Dash, http://netmetrics.blogspot.com


Saturday, September 03, 2005 

Pixl Tracking - Tracking Ad Campaigns on the Internet

(Note: This posting is very similar to one posted at my GeoPlotting blog.)

Pixl tracking is a technique that originated when Internet marketers wanted to know if and when email subscribers opened their email. The basic concept is very simple: Send out an HTML-formatted email to subscribers of your e-newsletter or anyone who has given you permission to send the email offers. In the email, insert a 1x1 pixel image (i.e., essentially invisible) whose file lives on your web server. The image file is only requested when the email is viewed. This access will be recorded on your web server requests (access) log. Since you have access to this log file, you can see how many times the email was accessed and by how many different people (by IP address). This, of course, gives you at least an "impressions ratio" compared to the number of people who were sent the email.

If you are running several email campaigns, just use a different image file name for each campaign. You can in fact go one step better than a 1x1 pixel image. Instead, if you use a logo or a photo and have the image hyperlink to a web page, you will also be able to calculate a click-through rate for the emails. (Remember, this technique only works for HTML-formatted emails.) Of course, you can still get a click-through based on the number of people who received the email, and the number of people who clicked on any link in the email. If they number of people that viewed the email is much greater than the number of people that clicked through either on the image or some other link, then it's possible that your email content wasn't effective enough.

This method can be extended for other uses. For example, my blogs are on the free service Blogger.com, whose log files I have no access to. I can still capture a minimum of information (visitor IP address, date/ time/ zone of visit) by pixl tracking. I place a small photo image of myself on my web server, then link to it from each of my Blogger.com blogs. Since its my profile photo, anytime my blog is read, even on archived pages, the image file is requested back on my web server. My web server log captures the request. I've been tracking visitors this way. It's very rudimentary, and I don't have to write any web scripts, unless I want more information.

Another use for pixl tracking is for advertising campaigns in RSS Feeds. If you are advertising in someone else's RSS feed, you can track actual impressions. Depending on your advertising agreement, your logo or product image(s) may appear in one or more RSS Feed items. Each appearance of your images in the Feed should be hyperlinked to a web page on your website. If a subscriber to the Feed clicks on your image, they'll get your web page. This page request will be recorded on your web server. You can now compare the number of these page requests against the number of image impressions to get a click-through ratio.


(c) Copyright 2005-present, Raj Kumar Dash, http://netmetrics.blogspot.com


About me

  • I'm blogslinger
  • From Canada
  • Writer, author, former magazine editor and publisher, amateur photog, amateur composer, online writer/ blogger, online publisher, freelancer

  • My profile
Powered for Blogger
by Blogger Templates